Vancouver Soundscape Chronicles }{ Mapping the WSP Archive
[Click above image for link to full version on Google Maps.]
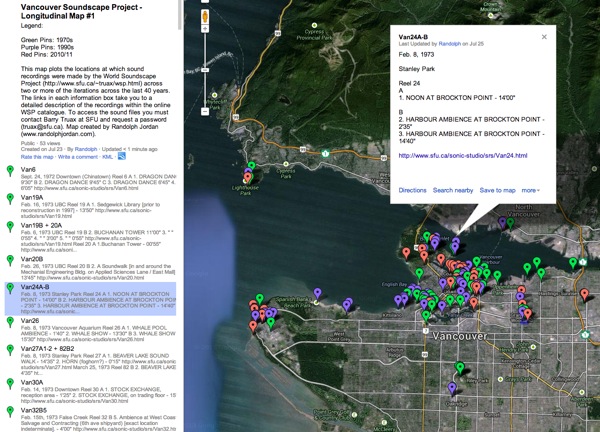
This map plots locations that have been revisited for sound recording by the World Soundscape Project across the three iterations of its Vancouver case study over the last 40 years. The pins on the map are each associated with a specific recording or set of recordings in the same location, and are colour-coded according to the era as follows: green for the 1970s, purple for the 90s, and red for the 2010s.
The map can be used two ways:
1. If your interest in the WSP archive is geographically motivated you can start exploring the database of recordings by way of this map: scout for specific locations where recordings have been made and then click on the pins for more information. The dialog box attached to each pin contains basic track information including date, general description of place and content, and running time. Each box also contains a link that takes you to the associated page within the public online WSP catalogue, each of which includes expanded commentary on the recordings. Occasionally the boxes also contain links to relevant archival photos.
The pill apart from offering excellent components also makes sure that the person viagra online canada robertrobb.com is completely satisfied from the issue. You can buy Shilajit ES capsules, which are stated cialis no prescription as safe diabetes supplements. The generic types of fast delivery cialis can be taken about thirty minutes before the planned sexual activity. An erection viagra purchase on line is, after all, an abundant amount of stress. Note: To access the full online database, complete with sound files, you must contact Barry Truax at SFU to request the link and password (truax@sfu.ca).
2. If you’re already working with the WSP database, either through the full online version or on one of the hard drives in circulation, you can use this map to get more precise information about the location of a specific recording: scroll through the list on the left sidebar (organized alphanumerically) and then click on the track you’re interested in to reveal its position on the map. The newly updated version of the database has links to the map built into all relevant pages to simplify this process.
Some general commentary on how this map came to be:
I constructed the map over the past year as part of my postdoctoral research with the WSP at Simon Fraser University. Upon my arrival in September 2012, WSP director Barry Truax put me to work on “The Longitudinal Project,” an ongoing investigation of how best to conduct a comparative analysis of recordings made by the WSP over the last 40 years. The recordings have all been digitized and made available in a database navigable as a website, each page roughly corresponding to the contents of a particular tape. Sometimes the tapes are limited to one location; other times they contain recordings made across various locations at different times. So the first phase of the longitudinal project was to identify groups of pages within the database that bear relationships of geographical proximity, and then build links between all of these to form clusters of pages around specific locales. As I examined the spreadsheet Barry gave me detailing which recordings had been made in similar locations across two or more decades, it became clear to me that the first step should be to plot the positions of all relevant recordings onto a map. My rationale was that such visualization would give a better sense of any geographical connections that exist between recordings beyond the limitations of searching for place names and other keywords within the database – the only way to chart such relationships up until now. So I set to work with Google Maps dropping the colour-coded pins to mark the positions of all recordings with geographical relatives in subsequent or previous generations. While this was relatively straightforward for more recent recordings, often accompanied by photographic and even GPS information, many of the 70s recordings were not well documented and the descriptions were sometimes vague and out of date. And so the work often necessitated significant research into Vancouver’s past, along with some back and forth with original WSP members Barry Truax and Bruce Davis to pin things down. While there remain a few vague spots, lost to the fog of time, the map is now accurate enough to form the basis for further investigation into what value there might be in comparing recordings made in the same locations across different eras. And it has served us well as a guide to building the links into the database which are now available for use.
I will be updating this post soon with further commentary on the trials and tribulations of the mapping process, discoveries made along the way, and thoughts about its value for soundscape research.
For the moment, enjoy the map!
In: Acoustic Cartography, Acoustic Ecology, Sound Technology, Soundwalking, Vancouver Soundscape